Reference | Getting started with Bokeh – Medium Post
在 Github 上查看交互式的绘图结果 | Bokeh 绘图入门 – Posted by Paradise
在这篇文章中,从最基本的绘图开始,逐步学习 Bokeh 中常用的绘图功能,目标是能满足大部分基础的绘图需求。
一、绘图基础
创建一个空白画布,并在浏览器中显示结果或者保存到本地:
import bokeh
import bokeh.io
import bokeh.plotting

fig = bokeh.plotting.figure()

bokeh.io.output_file('output.html')
bokeh.io.show(fig)
在画布上添加标记元素:
import numpy as np

fig = bokeh.plotting.figure()
x = np.linspace(-np.pi, np.pi, 30)
fig.line(x, np.sin(x))
bokeh.io.show(fig)
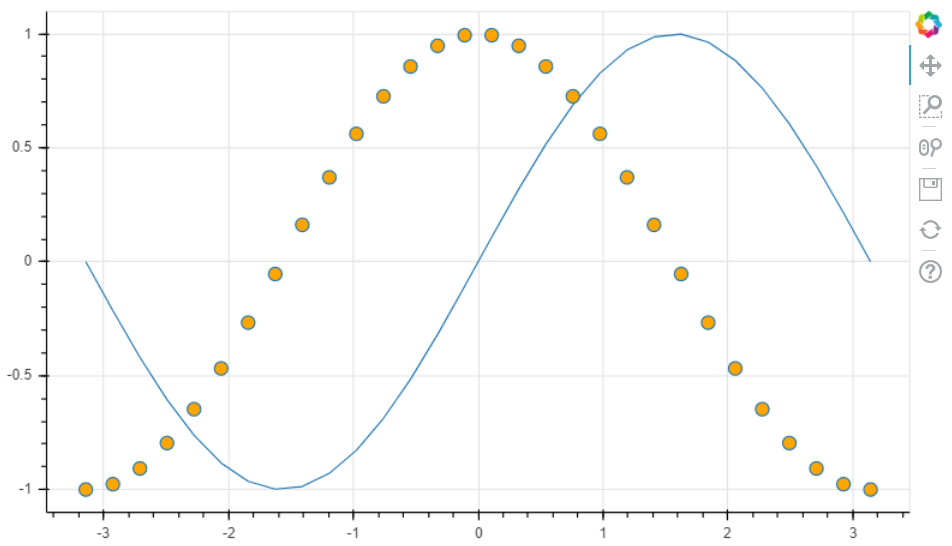
添加多个标记元素,按顺序显示:
fig = bokeh.plotting.figure()
fig.line(x, np.sin(x))
fig.circle(x, np.cos(x), fill_color='orange', size=10)
bokeh.io.show(fig)
二、更多画布设置
设置画布大小和工具栏:
fig = bokeh.plotting.figure(
    plot_width=800, plot_height=400,
    tools='pan, wheel_zoom, lasso_select, tap, undo, reset',
    toolbar_location='below')
bokeh.io.show(fig)
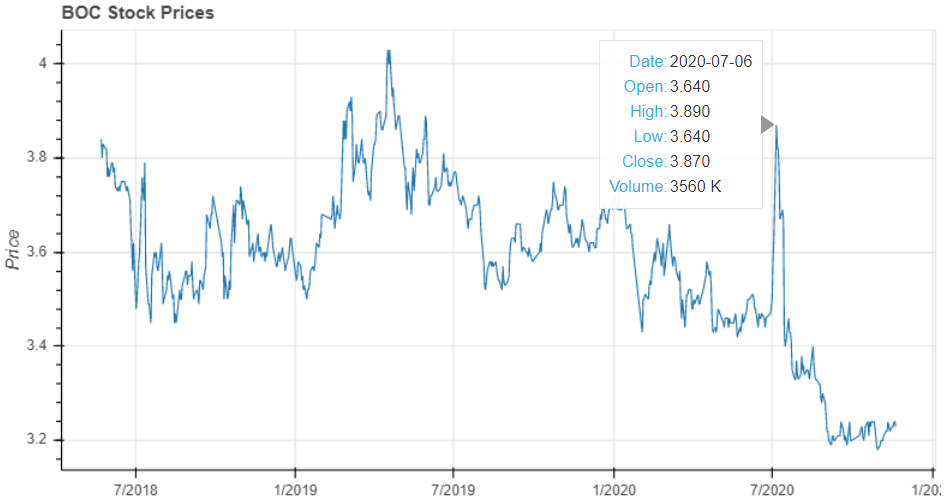
使用 models 转化 DataFrame,用 DataFrame 中的数据绘图,并设置悬停工具提示:
import tushare
import bokeh.models
import pandas as pd

# 获取中国银行股价历史数据,并准备工具提示
df = tushare.get_hist_data('601988')
df['index'] = pd.to_datetime(df.index)
df['Date'] = list(df.index)
df['volume_str'] = round(df.volume/1000).map(lambda x: str(int(x))+' K')
# df['color'] = ['green' if pc<0 else 'red' for pc in df.price_change]

# 转化 DataFrame 得到绘图数据源
source = bokeh.models.ColumnDataSource(df)

# 设置工具提示
hover = bokeh.models.HoverTool(tooltips=[
            ("Date", "@Date"),
            ("Open", "@open"),
            ("High", "@high"),
            ("Low", "@low"),
            ("Close", "@close"),
            ("Volume", "@volume_str")])

# 绘图(时序数据)
fig = bokeh.plotting.figure(
    x_axis_type='datetime',
    plot_width=800, plot_height=400,
    tools=[hover], toolbar_location=None,       # 工具提示
    title='BOC Stock Prices',                   # 标题
    x_axis_label='Date', y_axis_label='Price'   # 轴标签
    )
fig.line(x='index', y='close', source=source)
# fig.vbar(x='index', top='price_change', width=1, color='color', source=source)
bokeh.io.show(fig)
More examples for HoverTool
三、颜色设置
Documents of palettes
使用调色板映射数据标记,线性颜色映射:
import bokeh.palettes
import bokeh.transform

x = np.linspace(0, 10, 100)
mapper = bokeh.transform.linear_cmap(
    field_name='y',     # 对纵坐标数值进行映射
    palette=bokeh.palettes.Spectral6,   # 所有调色板:dir(bokeh.palettes)
    low=-1, high=1      # 映射数值范围
    )

fig = bokeh.plotting.figure(plot_width=600, plot_height=300)
fig.circle(x, np.sin(x), color=mapper, size=8)
bokeh.io.show(fig)

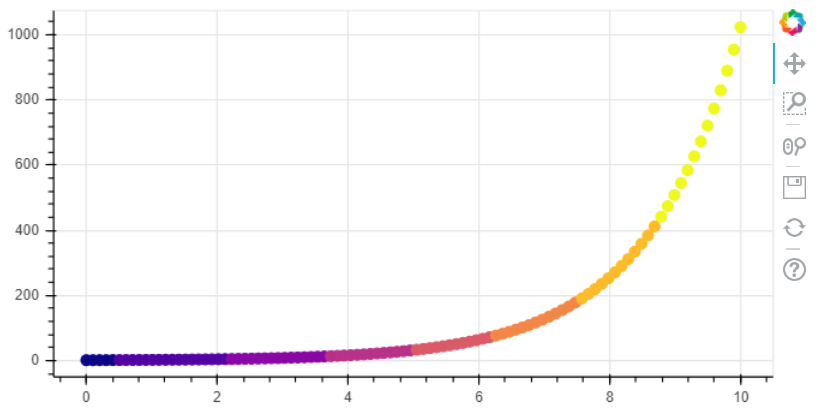
对数映射:
mapper = bokeh.transform.log_cmap(
    field_name='y',
    palette=bokeh.palettes.Plasma8,
    low=0, high=1024)
fig = bokeh.plotting.figure(plot_width=600, plot_height=300)
fig.circle(x, 2**x, color=mapper, size=8)
bokeh.io.show(fig)
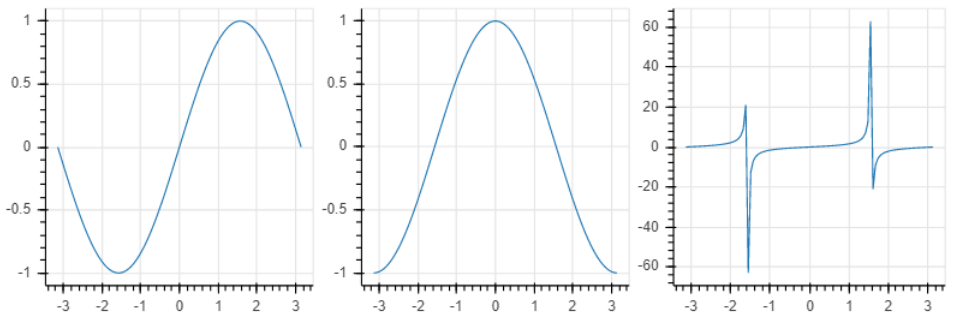
四、子图排列与关联
通过 layouts 子模块设置多个子图, 单行或单列布局:
import bokeh.layouts

def make_plot(func):
    fig = bokeh.plotting.figure(plot_width=400, plot_height=400, toolbar_location=None)
    x = np.linspace(-np.pi, np.pi, 100)
    fig.line(x, func(x))
    return fig
figs = [make_plot(func) for func in [np.sin, np.cos, np.tan]]

subplots = bokeh.layouts.row(*figs)     # 纵向布局使用 bokeh.layouts.column
bokeh.io.show(subplots)
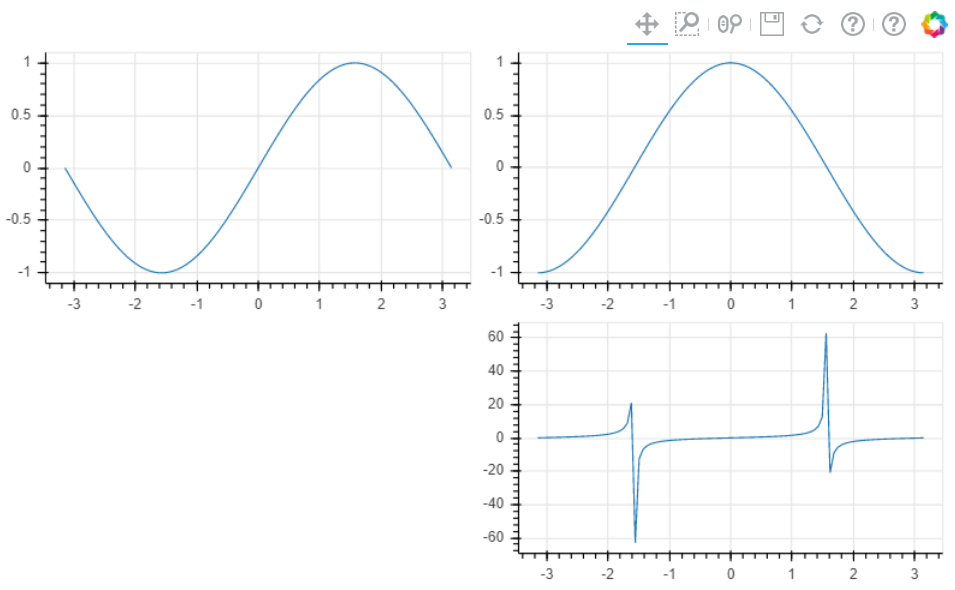
网格布局:
figs = [make_plot(func) for func in [np.sin, np.cos, np.tan]]
subplots = bokeh.layouts.gridplot([[figs[0],figs[1]], [None,figs[2]]])
bokeh.io.show(subplots)
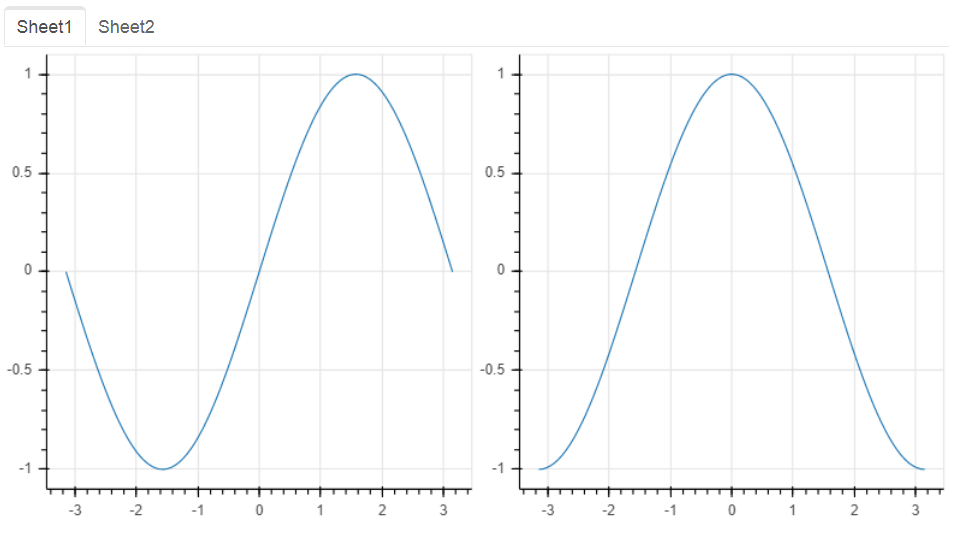
使用标签页进行布局,并联结每个子图的轴范围:
import bokeh.models.widgets as widgets

figs = [make_plot(func) for func in [np.sin, np.cos, np.tan]]
# 令图 1 和图 2 的轴范围在交互时同步变动
figs[0].x_range = figs[1].x_range
figs[0].y_range = figs[1].y_range

tab1 = widgets.Panel(child=bokeh.layouts.row(figs[0], figs[1]), title='Sheet1')
tab2 = widgets.Panel(child=bokeh.layouts.row(figs[2]), title='Sheet2')
tabs = widgets.Tabs(tabs=[tab1, tab2])
bokeh.io.show(tabs)