- mac设置中文字体
#要设置下面两行才能显示中文 Arial Unicode MS 为字体
plt.rcParams['font.sans-serif'] = ['Arial Unicode MS']
#设置图片大小
plt.figure(figsize=(20, 11), dpi=200)
-
pie官方文档
-
总体代码
```python
import pandas as pd
import numpy as np
import matplotlib.pyplot as plt

# 导入链家二手房数据
lianjia_df = pd.read_csv('./lianjia.csv')
# 删除没用的列
drop =['Id','Direction','Elevator','Renovation']
lianjia_df_clean = lianjia_df.drop(axis=1,columns=drop)
# 重新排列列位置
columns=['Region','District','Garden','Layout','Floor','Year','Size','Price']
lianjia_df_clean = pd.DataFrame(lianjia_df_clean,columns=columns)
lianjia_total_num = lianjia_df_clean['Region'].count()
# 导入安居客二手房数据
anjuke_df = pd.read_csv('./anjuke.csv')
# 数据清洗,重新摆放列位置
anjuke_df['District']=anjuke_df['Region'].str.extract(r'.+?-(.+?)-.+?',expand=False)
anjuke_df['Region']=anjuke_df['Region'].str.extract(r'(.+?)-.+?-.+?',expand=False)
columns=['Region','District','Garden','Layout','Floor','Year','Size','Price']
anjuke_df = pd.DataFrame(anjuke_df,columns=columns)
# 将两个数据集合并
# 增加一列,每平方的价格
df = pd.merge(lianjia_df_clean,anjuke_df,how='outer')
df['PriceMs']=df['Price']/df['Size']
# 对汇总数据进行清洗(Null,重复)
df.dropna(how='any')
df.drop_duplicates(keep='first',inplace=True)
# 删除价格大于25万一平
df = df.loc[df['PriceMs']<25]
anjuke_total_num = anjuke_df['Region'].count()
lianjia_total_num = lianjia_df_clean['Region'].count()
df_num = df['Floor'].count()
total_num = anjuke_total_num + lianjia_total_num
drop_num = total_num - df_num
print(total_num)
print(df_num)
print(drop_num)
26677
24281
2396
# 统计北京各区域二手房房价数量
df_house_count = df.groupby('Region')['Price'].count().sort_values(ascending=False)
print(df_house_count)
# 统计北京各区域二手房房价均值
df_house_mean = df.groupby('Region')['PriceMs'].mean().sort_values(ascending=False)
print(df_house_mean)
Region
朝阳       3147
海淀       2885
昌平       2878
丰台       2865
西城       2115
大兴       2106
通州       1600
房山       1575
东城       1517
顺义       1343
石景山       877
门头沟       500
亦庄开发区     457
北京周边      243
密云         89
平谷         51
怀柔         30
延庆          3
Name: Price, dtype: int64
Region
西城       10.710194
东城        9.897345
海淀        8.643937
朝阳        7.157441
丰台        5.781461
石景山       5.553180
亦庄开发区     4.721659
大兴        4.529565
通州        4.467039
顺义        4.316975
昌平        4.285696
门头沟       4.056528
怀柔        3.634485
房山        3.461693
平谷        2.553905
密云        2.518074
延庆        1.905722
北京周边      1.673941
Name: PriceMs, dtype: float64
def auto_x(bar,x_index):
x = []
for i in bar:
print(i)
x.append(i.get_x()+i.get_width()/2)
x = tuple(x)
plt.xticks(x,x_index)
# 设置一个在您的系统上可用的字体
plt.rcParams['font.sans-serif'] = ['Arial Unicode MS']
#设置图片大小
plt.figure(figsize=(20, 10))
# 创建一个子图
plt.subplot(211)
# 设置标题和标签
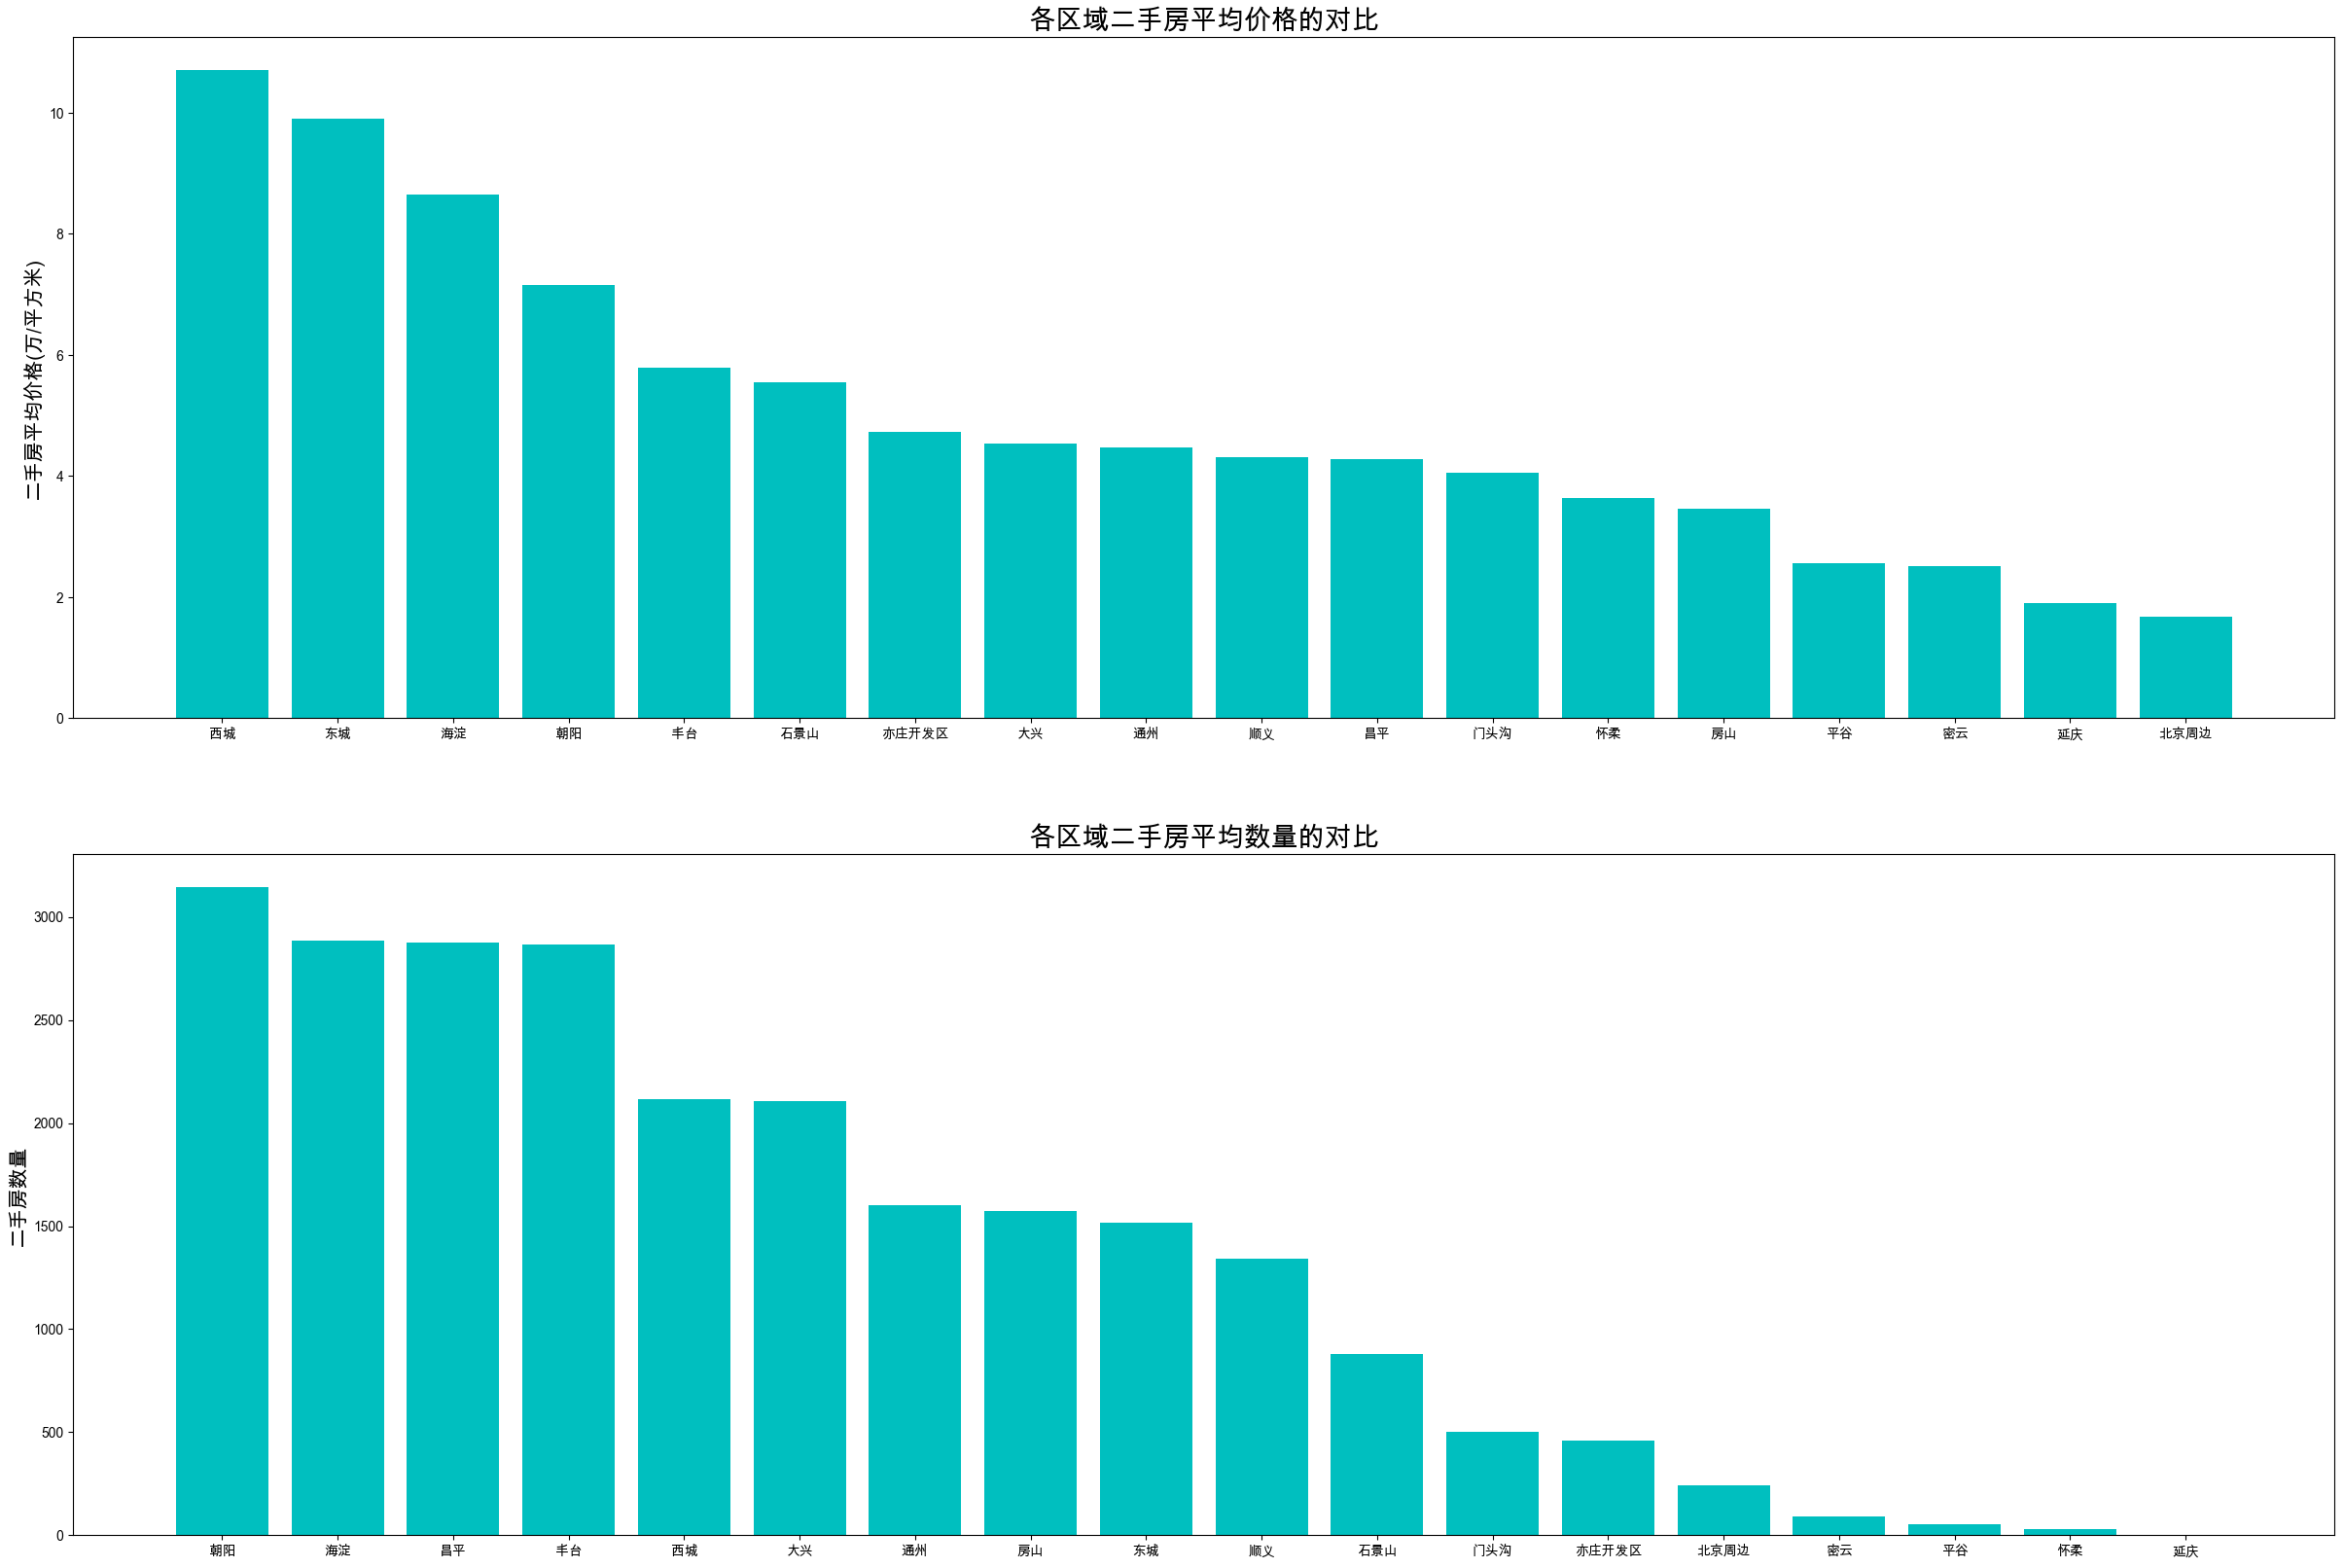
plt.title('各区域二手房平均价格的对比', fontsize=20)
plt.ylabel('二手房平均价格(万/平方米)', fontsize=15)
# 指定柱状图的 x 坐标和高度
bar1 = plt.bar(np.arange(len(df_house_mean.index)),df_house_mean.values,color='c')
auto_x(bar1,df_house_mean.index)
# 设置横坐标替换上面的代码
# bar1 = plt.bar(df_house_mean.index,df_house_mean,color='c')
plt.subplot(212)
plt.title('各区域二手房平均数量的对比', fontsize=20)
plt.ylabel('二手房数量', fontsize=15)
bar1 = plt.bar(np.arange(len(df_house_count.index)),df_house_count.values,color='c')
auto_x(bar1,df_house_count.index)
plt.show()
Rectangle(xy=(-0.4, 0), width=0.8, height=10.7102, angle=0)
Rectangle(xy=(0.6, 0), width=0.8, height=9.89735, angle=0)
Rectangle(xy=(1.6, 0), width=0.8, height=8.64394, angle=0)
Rectangle(xy=(2.6, 0), width=0.8, height=7.15744, angle=0)
Rectangle(xy=(3.6, 0), width=0.8, height=5.78146, angle=0)
Rectangle(xy=(4.6, 0), width=0.8, height=5.55318, angle=0)
Rectangle(xy=(5.6, 0), width=0.8, height=4.72166, angle=0)
Rectangle(xy=(6.6, 0), width=0.8, height=4.52956, angle=0)
Rectangle(xy=(7.6, 0), width=0.8, height=4.46704, angle=0)
Rectangle(xy=(8.6, 0), width=0.8, height=4.31697, angle=0)
Rectangle(xy=(9.6, 0), width=0.8, height=4.2857, angle=0)
Rectangle(xy=(10.6, 0), width=0.8, height=4.05653, angle=0)
Rectangle(xy=(11.6, 0), width=0.8, height=3.63449, angle=0)
Rectangle(xy=(12.6, 0), width=0.8, height=3.46169, angle=0)
Rectangle(xy=(13.6, 0), width=0.8, height=2.55391, angle=0)
Rectangle(xy=(14.6, 0), width=0.8, height=2.51807, angle=0)
Rectangle(xy=(15.6, 0), width=0.8, height=1.90572, angle=0)
Rectangle(xy=(16.6, 0), width=0.8, height=1.67394, angle=0)
Rectangle(xy=(-0.4, 0), width=0.8, height=3147, angle=0)
Rectangle(xy=(0.6, 0), width=0.8, height=2885, angle=0)
Rectangle(xy=(1.6, 0), width=0.8, height=2878, angle=0)
Rectangle(xy=(2.6, 0), width=0.8, height=2865, angle=0)
Rectangle(xy=(3.6, 0), width=0.8, height=2115, angle=0)
Rectangle(xy=(4.6, 0), width=0.8, height=2106, angle=0)
Rectangle(xy=(5.6, 0), width=0.8, height=1600, angle=0)
Rectangle(xy=(6.6, 0), width=0.8, height=1575, angle=0)
Rectangle(xy=(7.6, 0), width=0.8, height=1517, angle=0)
Rectangle(xy=(8.6, 0), width=0.8, height=1343, angle=0)
Rectangle(xy=(9.6, 0), width=0.8, height=877, angle=0)
Rectangle(xy=(10.6, 0), width=0.8, height=500, angle=0)
Rectangle(xy=(11.6, 0), width=0.8, height=457, angle=0)
Rectangle(xy=(12.6, 0), width=0.8, height=243, angle=0)
Rectangle(xy=(13.6, 0), width=0.8, height=89, angle=0)
Rectangle(xy=(14.6, 0), width=0.8, height=51, angle=0)
Rectangle(xy=(15.6, 0), width=0.8, height=30, angle=0)
Rectangle(xy=(16.6, 0), width=0.8, height=3, angle=0)
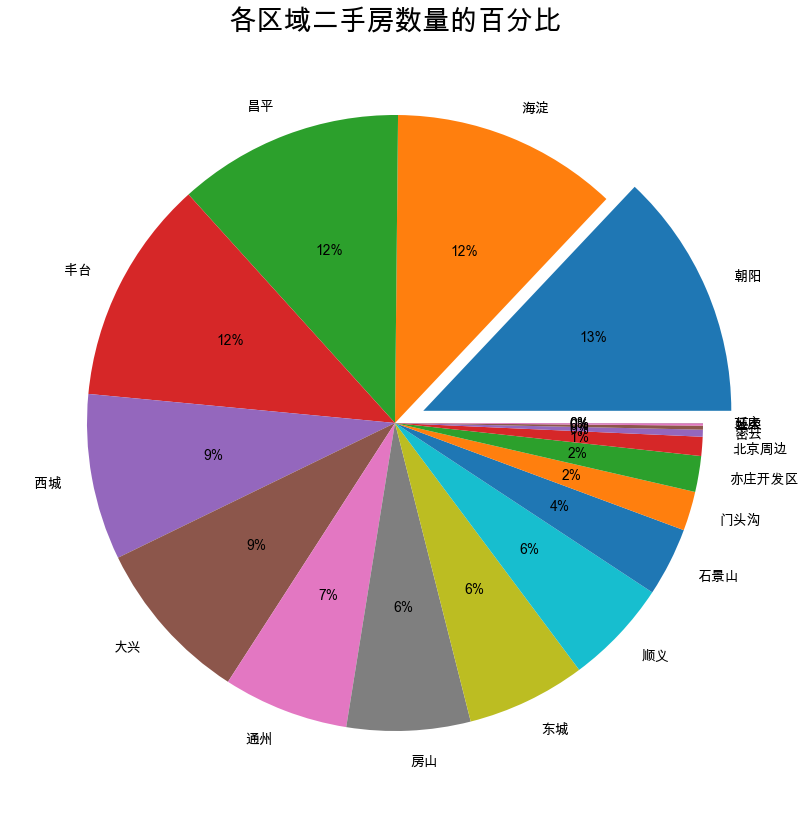
# 各区域二手房数量百分比
plt.figure(figsize=(10, 10))
plt.title('各区域二手房数量的百分比',fontsize=20)
ex = [0]*len(df_house_count)
ex[0] = 0.1
plt.pie(df_house_count,radius=1,autopct='%1.f%%',labels=df_house_count.index,explode=ex)
plt.show()
# 获取二手房总价的范围
def get_price_range(price, base=100):
return '{0}-{1}'.format(int(price//base)*base, int(price//base)*base+base)
# 获取二手房面积的范围
def get_size_range(size, base=30):
return '{0}-{1}'.format(int(size//base)*base, int(size//base)*base+base)
# 筛选房屋总价小于1000万的二手房信息进行统计 \d+表示一到多个数字
df['GroupPrice'] = df['Price'].apply(get_price_range)
df['GroupPriceSplit'] = df['GroupPrice'].str.extract('(\d+)-\d+', expand=False)
df['GroupPriceSplit'] = df['GroupPriceSplit'].astype('int')
sort_by_price_range = df.loc[df['GroupPriceSplit']<1000, ['GroupPrice','Price','GroupPriceSplit']]
sort_by_price_range.set_index('GroupPrice', inplace=True)
sort_by_price_range.sort_values(by='GroupPriceSplit', inplace=True)
# 筛选房屋面积小于300万的二手房信息进行统计
df['GroupSize'] = df['Size'].apply(get_size_range)
df['GroupSizeSplit'] = df['GroupSize'].str.extract('(\d+)-\d+', expand=False)
df['GroupSizeSplit'] = df['GroupSizeSplit'].astype('int')
sort_by_size_range = df.loc[df['GroupSizeSplit']<300, ['GroupSize','Size','GroupSizeSplit']]
sort_by_size_range.set_index('GroupSize', inplace=True)
sort_by_size_range.sort_values(by='GroupSizeSplit', inplace=True)
display(sort_by_size_range)
# 对房价和房屋面积分组
df_group_price = sort_by_price_range.groupby('GroupPrice')['Price'].count()
df_group_size = sort_by_size_range.groupby('GroupSizeSplit')['Size'].count()
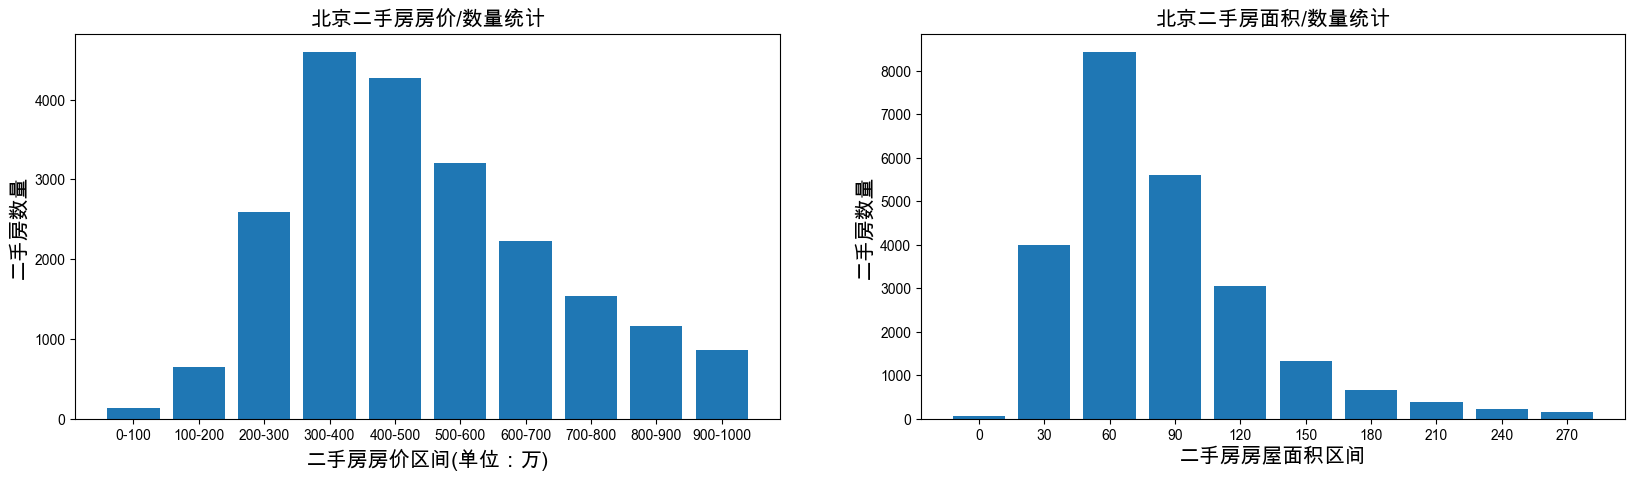
# 房价范围 vs 房屋数量可视化分析
fig_group_pirce = plt.figure(figsize=(20,5))
plt.subplot(121)
plt.title(u'北京二手房房价/数量统计', fontsize=15)
plt.xlabel(u'二手房房价区间(单位:万)', fontsize=15)
plt.ylabel(u'二手房数量', fontsize=15)
rect_group_price = plt.bar(np.arange(len(df_group_price.index)), df_group_price.values)
auto_x(rect_group_price, df_group_price.index)
plt.subplot(122)
plt.title(u'北京二手房面积/数量统计', fontsize=15)
plt.xlabel(u'二手房房屋面积区间', fontsize=15)
plt.ylabel(u'二手房数量', fontsize=15)
rect_group_size = plt.bar(np.arange(len(df_group_size.index)), df_group_size.values)
auto_x(rect_group_size, df_group_size.index)
plt.show()
| Size | GroupSizeSplit | |
|---|---|---|
| GroupSize | ||
| 0-30 | 22.0 | 0 |
| 0-30 | 20.0 | 0 |
| 0-30 | 29.0 | 0 |
| 0-30 | 15.0 | 0 |
| 0-30 | 28.0 | 0 |
| ... | ... | ... |
| 270-300 | 273.0 | 270 |
| 270-300 | 298.0 | 270 |
| 270-300 | 284.0 | 270 |
| 270-300 | 280.0 | 270 |
| 270-300 | 275.0 | 270 |
23877 rows × 2 columns
Rectangle(xy=(-0.4, 0), width=0.8, height=129, angle=0)
Rectangle(xy=(0.6, 0), width=0.8, height=641, angle=0)
Rectangle(xy=(1.6, 0), width=0.8, height=2588, angle=0)
Rectangle(xy=(2.6, 0), width=0.8, height=4601, angle=0)
Rectangle(xy=(3.6, 0), width=0.8, height=4277, angle=0)
Rectangle(xy=(4.6, 0), width=0.8, height=3207, angle=0)
Rectangle(xy=(5.6, 0), width=0.8, height=2227, angle=0)
Rectangle(xy=(6.6, 0), width=0.8, height=1535, angle=0)
Rectangle(xy=(7.6, 0), width=0.8, height=1167, angle=0)
Rectangle(xy=(8.6, 0), width=0.8, height=864, angle=0)
Rectangle(xy=(-0.4, 0), width=0.8, height=56, angle=0)
Rectangle(xy=(0.6, 0), width=0.8, height=3997, angle=0)
Rectangle(xy=(1.6, 0), width=0.8, height=8441, angle=0)
Rectangle(xy=(2.6, 0), width=0.8, height=5608, angle=0)
Rectangle(xy=(3.6, 0), width=0.8, height=3046, angle=0)
Rectangle(xy=(4.6, 0), width=0.8, height=1334, angle=0)
Rectangle(xy=(5.6, 0), width=0.8, height=663, angle=0)
Rectangle(xy=(6.6, 0), width=0.8, height=371, angle=0)
Rectangle(xy=(7.6, 0), width=0.8, height=219, angle=0)
Rectangle(xy=(8.6, 0), width=0.8, height=142, angle=0)